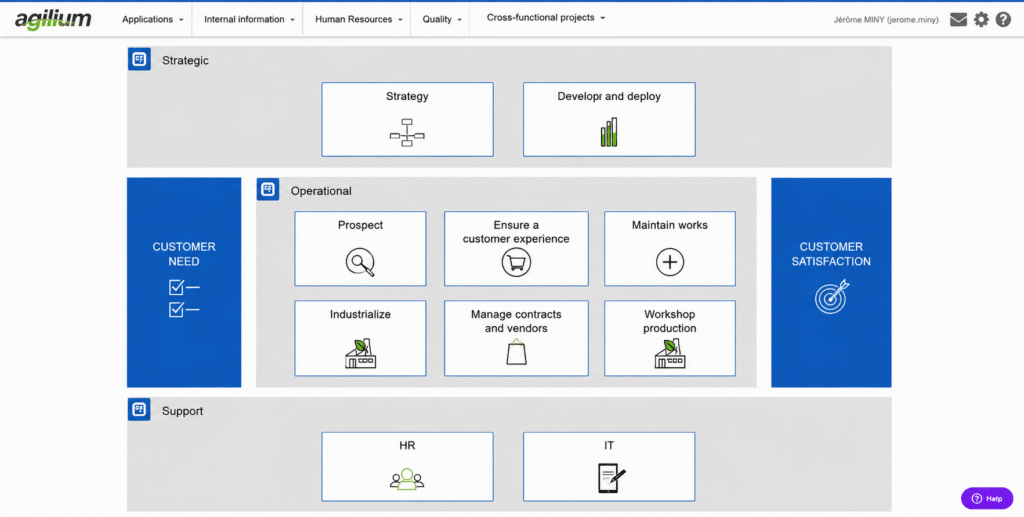


A useful process map should provide a quick understanding of:
– What are the organization’s processes?
– Who manages them?
– How do they relate to one another?
– What documents, metrics, risks, and actions are associated with them?
Even though it only shows boxes and arrows, it helps with drawing—not with flying.
What is process mapping?
A process map is a visual representation of an organization’s activities and how they interact with one another.
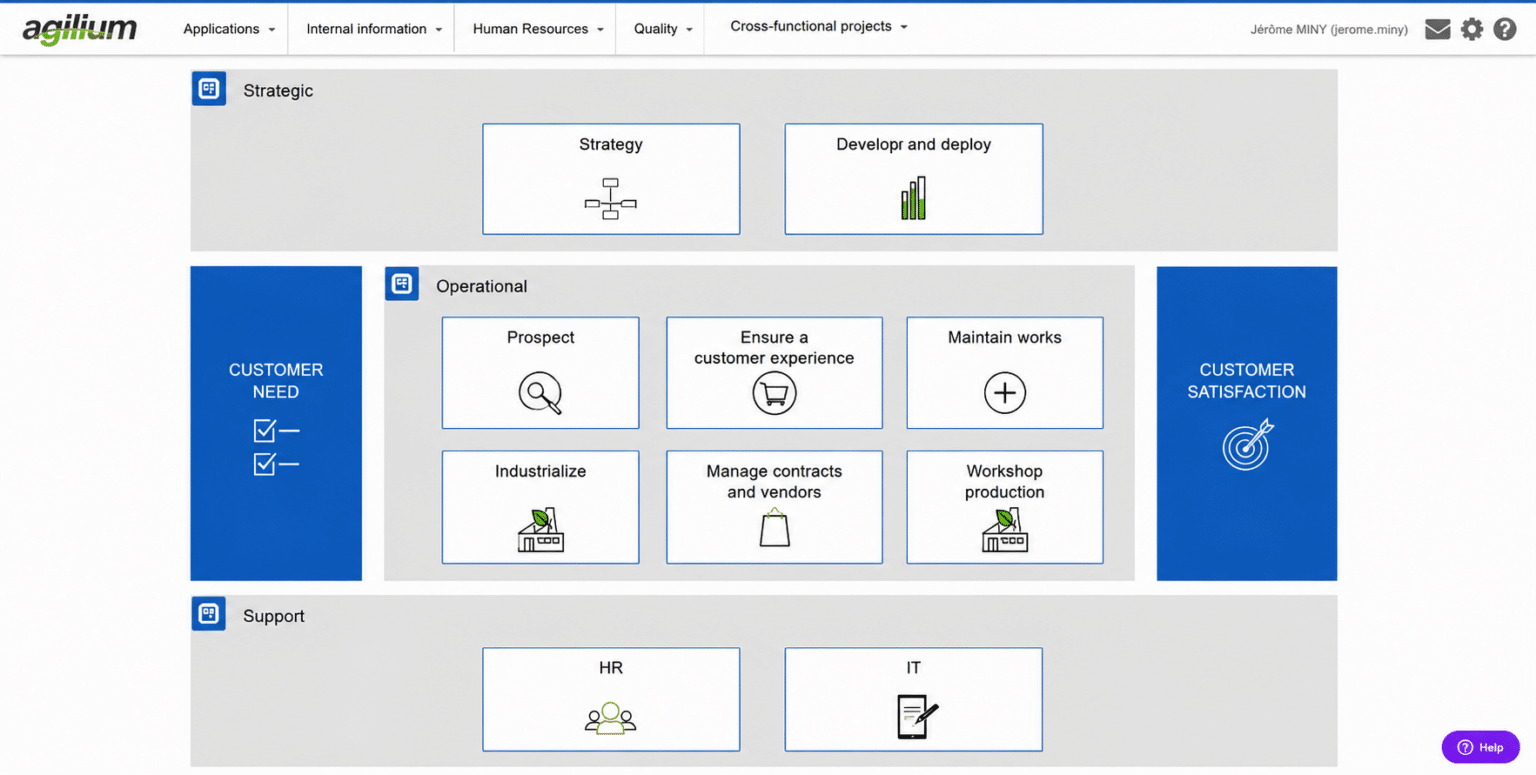
In a quality assurance process, it is generally used to highlight three main categories:
– management processes;
– implementation processes;
– support processes.
Its purpose is simple: to make the organization’s structure clear. It often serves as the starting point for linking documentation, process descriptions, metrics, risks, audits, and action plans.
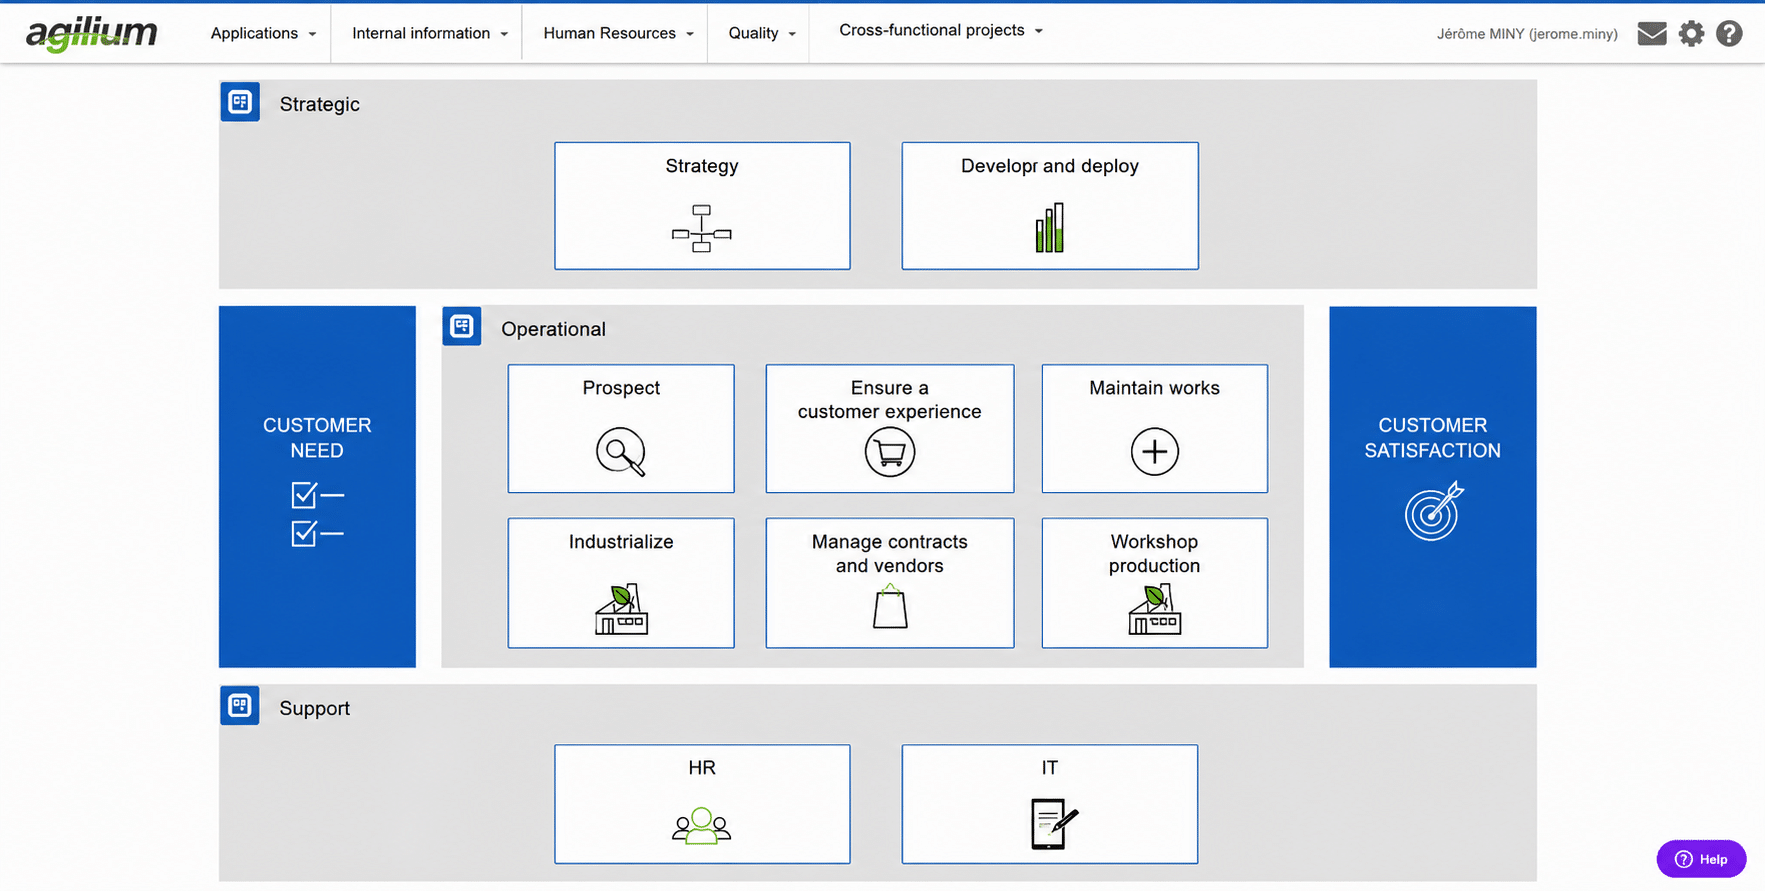
What is the practical purpose of process mapping?
Good mapping isn’t just about documenting the current state. It also helps ensure the quality system functions properly.
Make the organization easier to understand
When processes remain implicit, everyone compensates in their own way. Mapping brings a shared vision back to the table.
Clarify Responsibilities
It allows you to see who is in charge of what, where the interfaces between services begin, and where gray areas arise.
Bringing the QMS to Life
A map becomes truly useful when it is not isolated. It should make it easy to locate the documents, reviews, indicators, risks, and actions associated with each process.
What does a good process mapping template include?
Process mapping is not intended to cover everything. It serves as a starting point.
It should allow users to navigate intuitively to other elements:
- the process name and its description
- his family: directing, producing, or support;
The elements of the process sheet
- the requirements,
- comments;
- the objectives;
- a release date;
- the process driver;
- the purpose of the process;
- its main activities;
- its input data;
- its output data;
- the roles or individuals responsible for each step;
- its main interactions;
- Resources mobilized: internal staff, service providers, equipment;
- the relevant stakeholders;
Related documentation:
- the related documents or forms;
- access to the downloadable process sheet;
- a flowchart to visualize the process;
QMS Data
- process monitoring indicators,
- related actions,
- risks and opportunities,
- nonconformities related to this process,
- a SWOT analysis,
- the list of process reviews,
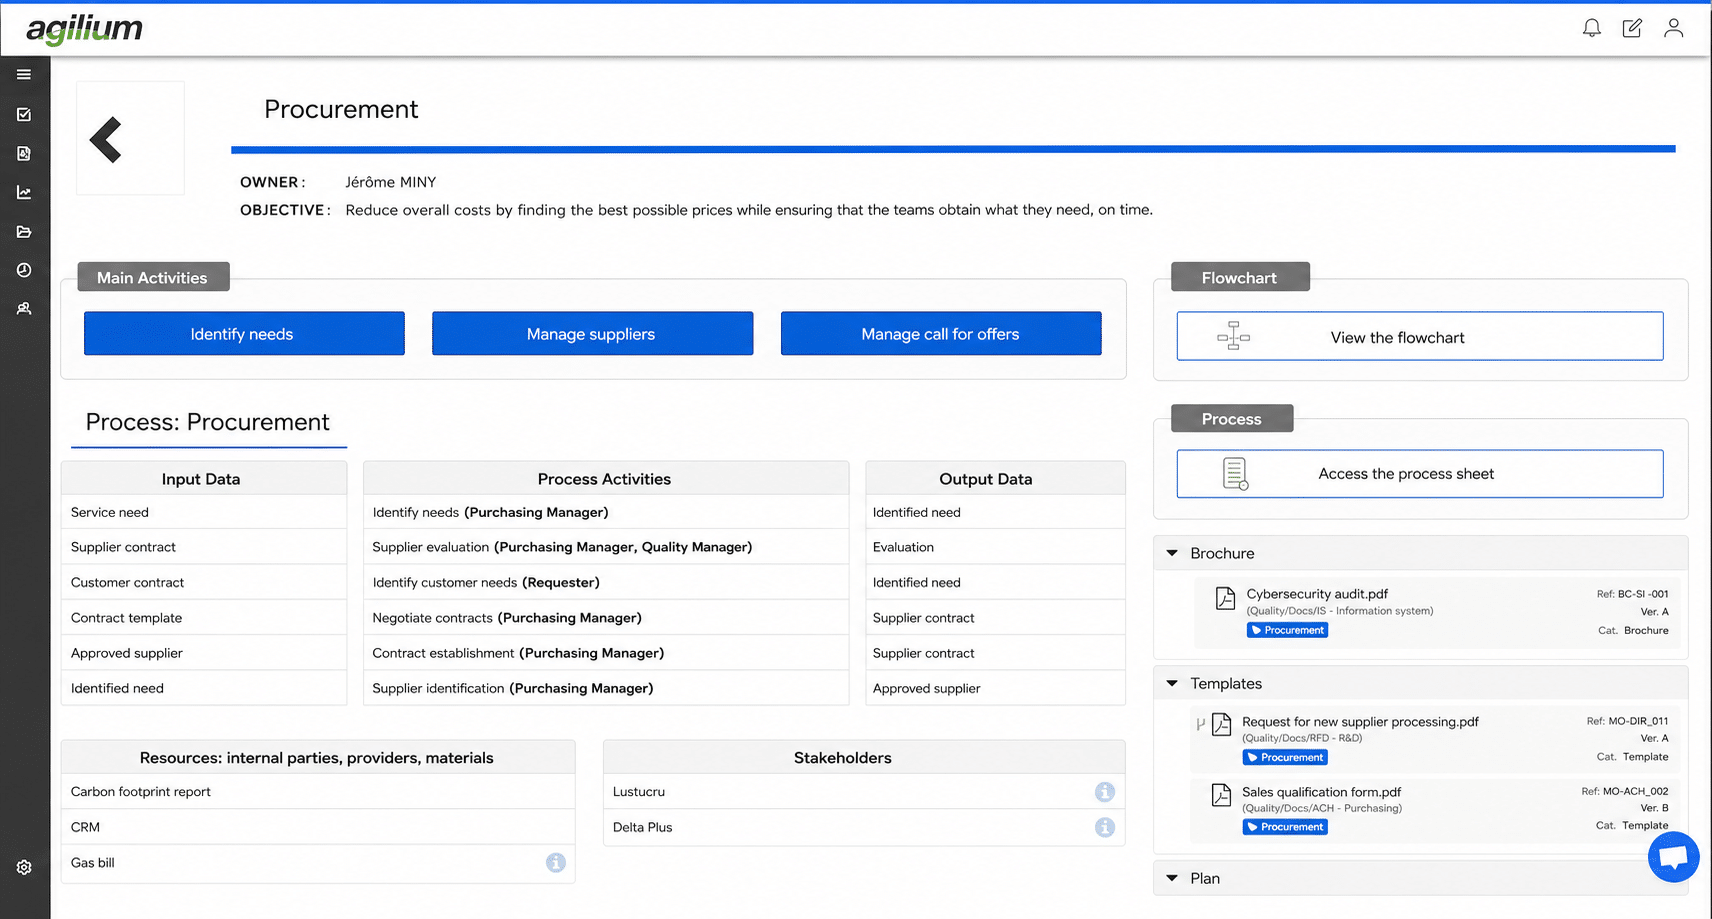
The image clearly illustrates this logic: a process is not limited to a title or a few arrows. It is linked to an objective, to specific activities carried out, to inputs and outputs, to documents, to resources, and to stakeholders.
It is this structure that transforms a map into a management tool, not just a presentation diagram.
Download the process mapping template
Writing Guide and Templates
What’s the best way to bring your process map to life?
Creating this map in software completely changes how it’s used on a daily basis.
We no longer rely on a static diagram set out in a document: each process becomes navigable, linked to its detailed description, documentation, templates, flowchart, metrics, and associated actions.
Teams can access useful information more easily, without having to search through multiple scattered files or folders.
The code is easier to read, the relationships between processes are clearer, and the system remains easier to maintain over time.
When you add automatic reminders, notifications, and centralized updates, mapping is no longer just a way to represent the organization—it becomes a true management tool.
Download our process mapping template
This document is a comprehensive guide to process mapping, designed to help organizations structure, visualize, and better manage their quality system.
It combines educational explanations, concrete examples of flowcharts and process maps, and practical guidelines for linking processes, documentation, and continuous improvement.
His main point is to show that useful mapping should not remain theoretical: it must be clear, kept up to date, and directly applicable to operational management.
Download the process mapping template
Writing Guide and Templates
Case Study: How UPEC Brought Its Process Map to Life
UPEC’s experience is interesting because it demonstrates a more sophisticated use of mapping in a complex context.
The university has digitized its quality system across multiple sites, involving several entities and multiple quality certifications to manage. In this context, the mapping was not intended to be a single, static image.
It has been adapted in several ways:
– at the institutional level;
– at the unit level;
– at the business domain level.
This approach is particularly useful in organizations where the diversity of job roles makes a single perspective insufficient.

“At UPEC, we’ve used Agilium’s process mapping at several levels: at the institutional level, the unit level, and the business domain level. This flexibility allows us to help everyone understand their place within their environment—whether in central services, academic units, or laboratories—and to more easily access the processes that are relevant to them.”
The UPEC case shows that a map becomes more valuable when:
- It helps everyone understand their role within the organization;
- It can be viewed by environment or by business unit;
- It remains flexible enough to evolve over time.
- when it is updated regularly.
A process that evolves without corresponding updates to the documentation creates a discrepancy between the reality on the ground, the quality documentation, and what will be observed during an audit.
Agilium’s Role
With Agilium, process mapping is not just a standalone view. It can serve as a gateway to:
– related documentation;
– detailed process documentation;
– metrics;
– risks;
– process reviews;
– improvement actions.
The challenge is not just to map out the processes, but to link them to the actual operation of the QMS.